← Home · Geophysics

Seismic Tomography (Refraction/Reflection) for Site Characterization in San Jose

Together, we solve the challenges of tomorrow.

LEARN MORE →

San Jose’s growth from agricultural valley to tech capital brought infrastructure onto some of the most seismically complex ground in California. The Santa Clara Valley basin, with its deep alluvial deposits and proximity to the Silver Creek and Evergreen faults, creates a subsurface where borehole data alone often misses critical lateral variations. That is where we turn to seismic tomography methods, both refraction and reflection, to image what lies between and below the borings. In our expertise mapping sites near the Coyote Creek floodplain, the basin’s alternating gravels and soft clays generate velocity contrasts that reflection profiling resolves with clarity unattainable by standard drilling. We combine these tomographic profiles with selective test pits when near-surface validation is needed, and with MASW surveys to capture shear-wave velocity for seismic site class determination per ASCE 7-22.

A velocity inversion at 40 feet in a San Jose basin profile often signals the contact between Holocene alluvium and older Pleistocene deposits, a boundary with major implications for settlement and liquefaction.

Approach and scope

The field setup we deploy across San Jose sites typically involves a 48- or 96-channel seismograph with 4.5 Hz geophones spaced at intervals adjusted to the target depth: tight 2-meter spacing for high-resolution refraction on pavement projects, wider 5-meter arrays for deeper reflection imaging down to 200 feet. The energy source varies by site constraints in the urban grid. On open lots near the Berryessa district we use an accelerated weight drop; in tighter downtown locations, where vibration sensitivity near historic structures is a concern, we switch to a sledgehammer and plate system stacked 8 to 12 times per shot point. The raw gathers are processed through first-arrival tomography and CMP reflection workflows, generating velocity models that reveal not just bedrock depth but also low-velocity zones potentially associated with fault gouge or groundwater channels within the alluvium. These models feed directly into the liquefaction triggering analyses we run for projects located within the FEMA-designated moderate-to-high hazard zones that cross much of San Jose’s valley floor.
Seismic Tomography (Refraction/Reflection) for Site Characterization in San Jose
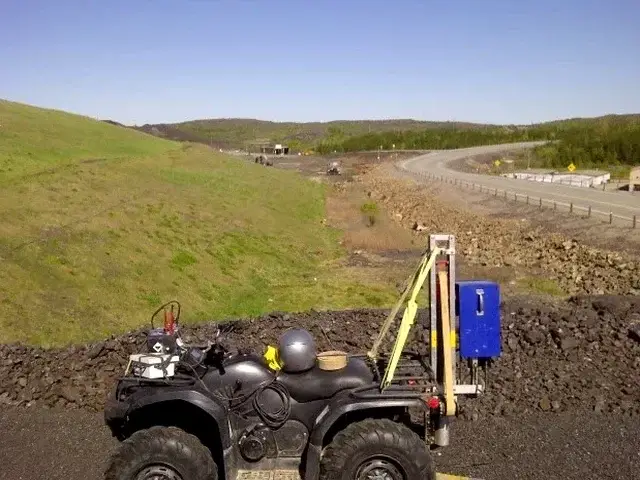
Technical reference image — San Jose

Site-specific factors

The contrast between the Diablo Range foothills and the valley floor creates two distinct risk profiles for seismic surveys in San Jose. In the eastern uplands, shallow Franciscan Complex bedrock generates strong refraction returns but also introduces scattering from fractured melange, requiring careful first-break picking by an experienced processor. Down in the basin, near the Guadalupe River corridor, thick unsaturated sands above the water table attenuate seismic energy rapidly; a refraction survey that works well in Milpitas may struggle at a site on Trimble Road unless we double the stack count and extend the spread length. The most consequential risk we encounter is a misinterpreted blind-thrust structure hidden within a low-velocity zone: mislocating bedrock by even 15 feet on a high-rise foundation can cascade into costly redesign. We mitigate this by running joint inversion with resistivity data and by tying seismic lines to at least one borehole for velocity calibration.

Need a geotechnical assessment?

Reply within 24h.

Email: info@geotechnicalengineering1.com

Technical parameters

ParameterTypical value
Typical array length (refraction)115 to 230 ft for 24/48-ch; up to 500 ft for 96-ch deep targets
Depth of investigation (refraction)15 to 100 ft below ground surface, velocity-dependent
Depth of investigation (reflection)30 to 300+ ft, suitable for deep basin imaging
Geophone frequency4.5 Hz vertical-component, occasionally 10 Hz for shallow refraction
Source typeAccelerated weight drop, sledgehammer with plate, or Betsy gun in permitted areas
Processing softwareSeisImager, ReflexW, or VISTA for tomographic inversion and CMP stacking
Output deliverables2D P-wave velocity sections, interpreted geologic cross-sections, depth-to-bedrock contour maps

Complementary services

01

Seismic Refraction Tomography

P-wave velocity profiling for rippability assessment, depth to bedrock, and mapping of compacted versus loose zones within the alluvial column. We deploy 48-channel arrays with 5-meter spacing as standard, processing first arrivals through iterative ray-tracing inversion to produce 2D sections with RMS residuals typically below 2 milliseconds.

02

High-Resolution Seismic Reflection

Common-midpoint reflection surveys targeting stratigraphic boundaries, fault offsets, and basin geometry below 100 feet. This method excels in the layered alluvial environment of San Jose, where impedance contrasts between gravel aquifers and clay aquitards generate clean reflections that we can trace laterally across a site.

03

Combined Refraction-Reflection Survey with Borehole Calibration

Integrated geophysical program where we run both seismic methods over the same spread and tie the velocity model to an existing soil boring or CPT log. This approach reduces ambiguity in interpreting low-velocity zones and is the configuration we recommend for critical structures requiring site-specific ground motion analysis under ASCE 7 Chapter 21.

Relevant standards

ASCE 7-22: Minimum Design Loads and Associated Criteria for Buildings and Other Structures (site classification, Vs30), IBC 2024: International Building Code seismic provisions adopted by City of San José, ASTM D5777-18: Standard Guide for Using the Seismic Refraction Method for Subsurface Investigation, ASTM D7128-18: Standard Guide for Using the Seismic Reflection Method for Shallow Subsurface Investigation, Caltrans Geophysical Methods Manual, Section 5: Seismic Refraction and Reflection Guidelines

Common questions

How much does a seismic refraction or reflection survey cost for a site in San Jose?

For a standard San Jose lot with a 48-channel refraction line and basic processing, the cost typically runs between US$2,990 and US$5,770, depending on survey length, number of spreads, and whether we are combining refraction with reflection acquisition. Larger commercial sites requiring multiple lines, 96-channel arrays, or joint inversion with resistivity will fall toward the upper end or beyond, and we carry out a fixed-price proposal after reviewing the site plan and target depths.

When should I choose seismic reflection over refraction for a San Jose basin site?

Refraction works best when velocity increases with depth, which is common at shallow bedrock sites in the eastern foothills. In the deep alluvial basin, where low-velocity clays may overlie higher-velocity gravels, refraction can miss velocity inversions entirely. Reflection does not depend on a velocity-increasing model and images stratigraphic boundaries directly, making it the preferred method for projects near downtown San Jose or along the Guadalupe River where we have mapped multiple aquifer-confining unit interfaces below 80 feet.

How do you handle vibration and noise restrictions in urban San Jose neighborhoods?

We coordinate with the City of San José Public Works and the property owner to schedule surveys during permissible hours, and we use weight-drop sources or stacked sledgehammer shots rather than explosives in residential and commercial zones. In areas with high ambient noise from traffic or light rail, we increase the vertical stack count and monitor noise windows to shoot during quieter intervals; the processing workflow includes band-pass filtering and f-k noise suppression to clean up the gathers before picking first arrivals.
Location and service area

We serve projects in San Jose and surrounding areas.

View larger map