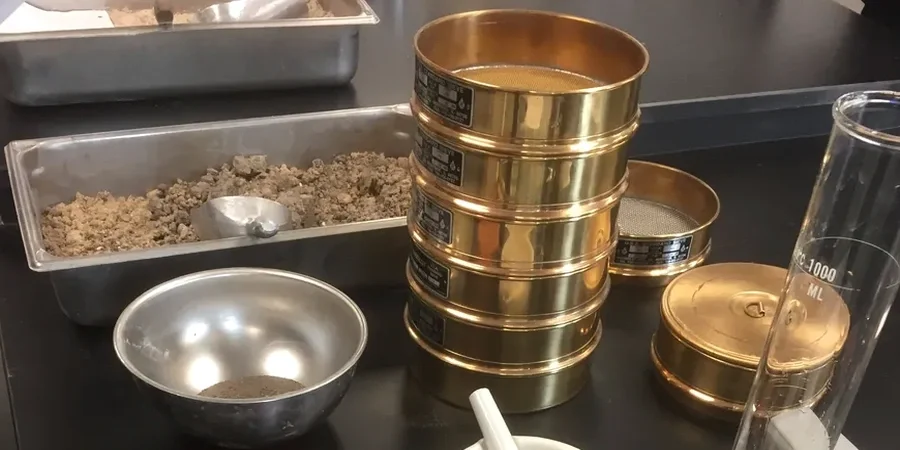
A common mistake in San Jose is assuming all valley soil behaves like uniform sand. That assumption leads to underestimated settlement or drainage failures. We see it often on sites near Coyote Creek where thin silt lenses get overlooked. A proper grain size analysis catches those layers before they become a problem. Our lab runs the full curve: mechanical sieves for the coarse fraction and a hydrometer for fines passing the No. 200 sieve. The result is a precise ASTM D2487 classification that feeds directly into foundation design, permeability estimates, and fill suitability. Many projects in the city also pair this with a CBR test for road subgrade when the grain size distribution suggests marginal material.
In the Santa Clara Valley, a missing silt layer on the grain size curve can delay a project by weeks.
Approach and scope
San Jose sits on the alluvial plain of the Santa Clara Valley, where soil can shift from clean sands to fat clays in less than 50 feet horizontally. This variability makes grain size analysis non-negotiable. We wash samples through a full stack of sieves per ASTM D422, then run the hydrometer on the minus 200 fraction. The combined curve tells you the coefficient of uniformity, coefficient of curvature, and the exact percentages of gravel, sand, silt, and clay. For projects near the Guadalupe River or in the Evergreen foothills, these numbers dictate whether you need imported fill, lime treatment, or a deeper excavation. We also cross-check results against Atterberg limits when plasticity is suspected in the fines.
Common questions
What does a grain size analysis cost in San Jose?
A combined sieve and hydrometer test typically runs between US$110 and US$210 per sample, depending on the number of sieves and whether the hydrometer is needed. Most San Jose projects require both for a complete USCS classification. We carry out a firm quote once we know the sample count and turnaround time.
How is the grain size analysis performed?
We oven-dry the sample, break it down with a rubber mallet, and run it through a stack of sieves on a mechanical shaker. The material passing the No. 200 sieve goes into a sedimentation cylinder with a dispersing agent. A hydrometer measures the density of the suspension at timed intervals. The two datasets are stitched together into one continuous curve.
What sample size do you need?
For sands and silts, 500 grams is usually enough. If the soil contains gravel up to 3/4 inch, we need about 1,500 grams. We can split larger samples in the lab. Just bring us a gallon-sized zip-lock bag of representative material from your excavation or boring.
How long does the test take?
A standard sieve analysis takes one business day. The hydrometer test requires a minimum 24-hour sedimentation period. Combined, expect results in 3 to 5 business days. We offer a 48-hour rush service for an additional fee.
Do you follow ASTM standards?
Yes. Our procedures follow ASTM D422 and D6913 for sieve analysis and ASTM D7928 for the hydrometer. The final classification is assigned per ASTM D2487, which is the standard referenced by the IBC and most San Jose building officials.